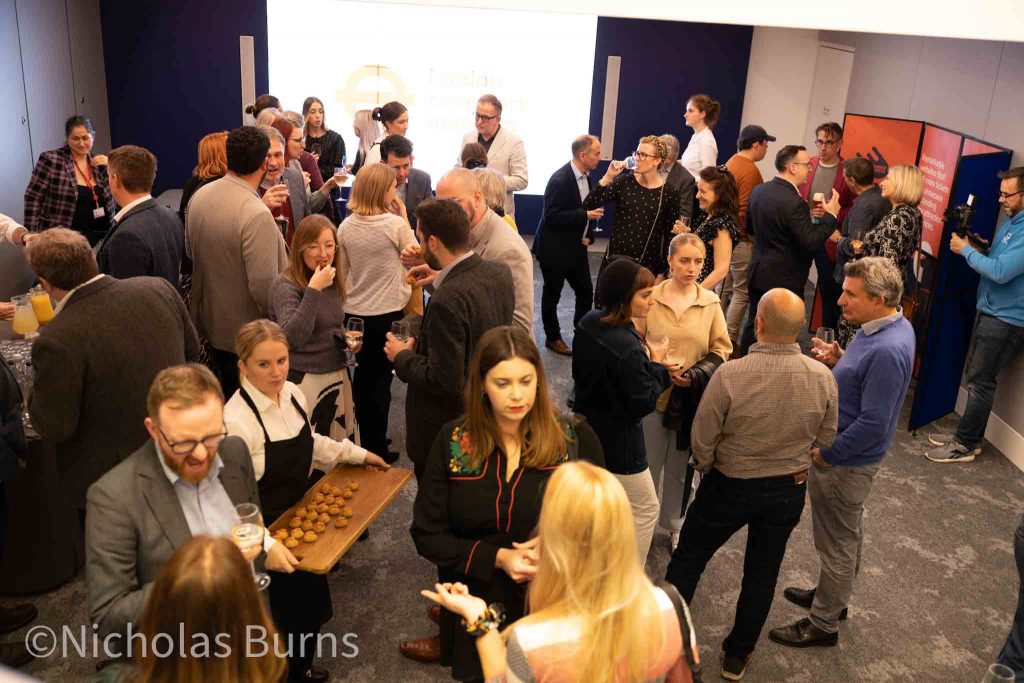
On November 15th, Rubber Cheese officially launched the 2022 Visitor Attraction Website Report, during a fabulous event at the London Transport Museum.
Over 60 visitor attraction professionals joined us for an evening of insight and inspiration, as we shared results from our gap analysis research looking into what ‘good’ looks like for visitor attraction websites.
Guests were welcomed with a drinks and canapé reception in the Cubic Theatre and Foyer, a truly magnificent venue kindly sponsored by our good friends at Convious. This was a fantastic opportunity to meet so many of our podcast guests in real life, and a great way to bring together the sector after two years of ‘virtual’ event.

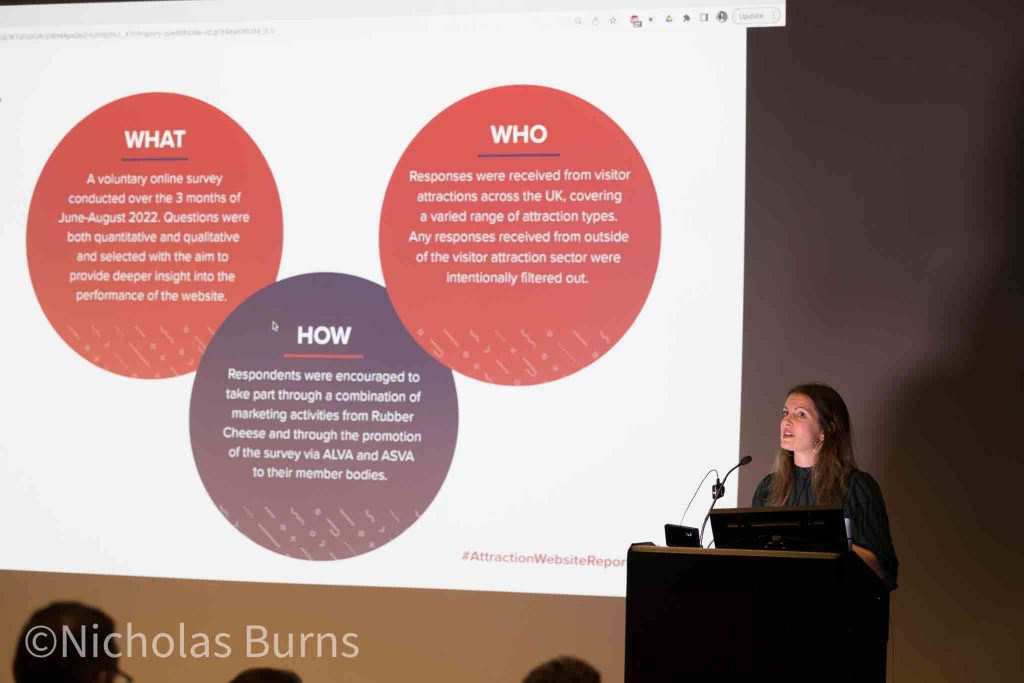
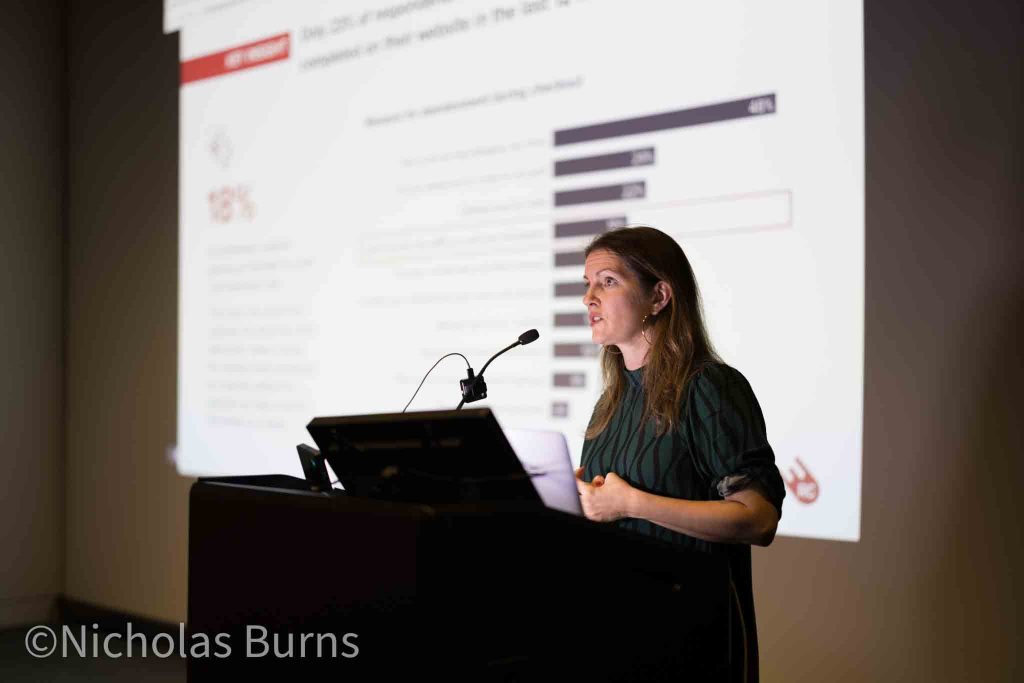
For the first time ever, thanks to this report, benchmarks related specifically to websites in the visitor attraction sector have been established. Kelly took to the stage to present the 4 key benchmarks and further insights into exactly how visitor attraction website are performing.
One key insight was that around 60% of respondents said their sites have a page load time of more than 2.5 seconds. Also, 75% of respondents stated there are more than five steps in their booking process before the completion of a purchase.

“The past few years have transformed how visitor attractions operate online forever,” says Kelly Molson, founder of Rubber Cheese. “With the increased need for online bookings, additional revenue drivers, and a seamless on and offline experience, it’s more important than ever for visitor attraction marketers to understand how their website is performing.
“But knowing what good looks like is almost impossible until we uncouple visitor attractions from the travel and tourism industry sector skewing the data. After all, an airline is not a comparable business to a theme park or museum.
“We realised that there has not been a focus on visitor attractions as a sector in its own right before, hence, this year’s Rubber Cheese Annual Visitor Attraction Website Report. We’re using this as the starting point, a springboard, to a deeper understanding of how to achieve the highest possible conversion rates within the visitor attraction sector.
“This first-of-its-kind piece of research looks only at websites related to visitor attractions of all types, but removes data related to price comparison sites for airlines and hotels. We’re generating meaningful insight for a visitor attraction category all of its own! And this refined data did NOT disappoint! The results have proved to be very exciting.”

The survey will take place each year going forward, and the subsequent reports will enable marketing professionals within the industry to gain a more accurate picture of what good performance looks like across similar branded websites, allowing for better decision-making with genuine insight.
If you want to know to national metrics for:
- Add to basket rate
- Basket abandonment rate
- Bounce rate
- Conversion rate
- Load times
Plus key insights into user experience, booking journeys and mobile experience, then download the report today.
By downloading the report, you’ll be invited to join us on number of webinars with our key partners, to highlight ways you can improve on the benchmarks, and key insights within it. These will include user experience, speed, mobile design and improving that all important booking journey.
Can we help you with your attraction website?
At Rubber Cheese we design and build remarkable websites that help sell more tickets and showcase outstanding visitor attraction experiences.
Taking a user centric approach, we focus on making continual improvements that deliver better conversions and increased revenue. We can support your existing WordPress or Umbraco website, or work with you to create a new one.
FIND OUT WHAT RUBBER CHEESE DO